HTML5 charts and graphs
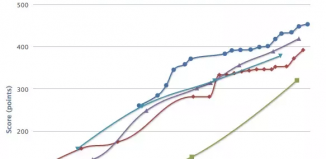
Today I have found one interesting library – flotr2. This is opensource library for drawing HTML5 charts and graphs. It allow to draw charts in different modes like: lines, bars, candles, pies, bubbles. More – it don’t require any extra libraries like jQuery or Prototype. And finally – it has good compatibility with different browsers. I have prepared our own demo for today’s lesson (using that library).
Here are our demo and downloadable package:
Live Demo
download in package
Ok, download the source files and lets start coding !
Step 1. HTML
This is markup of our final page. Here it is:
index.html
<!DOCTYPE html>
<html lang="en" >
    <head>
        <meta charset="utf-8" />
        <title>HTML5 charts and graphs - using Flotr2 | Script Tutorials</title>
        <link href="css/main.css" rel="stylesheet" type="text/css" />
        <script src="js/flotr2.min.js"></script>
        <!--[if lt IE 9]>
        <script type="text/javascript" src="js/flashcanvas.js"></script>
        <![endif]-->
    </head>
    <body>
        <header>
            <h2>HTML5 charts and graphs - using Flotr2</h2>
            <a href="https://www.script-tutorials.com/html5-charts-and-graphs/" class="stuts">Back to original tutorial on <span>Script Tutorials</span></a>
        </header>
        <div id="container" class="container"></div>
        <div class="controls">
            <h3>Function:</h3>
            <p>
                <input type="radio" name="func" value="1" onclick="toggleFunc(1)" checked> sin
                <input type="radio" name="func" value="2" onclick="toggleFunc(2)"> sin(1/x)
            </p>
            <h3>Visual mode:</h3>
            <p>
                <input type="radio" name="mode" value="1" onclick="toggleMode(1)" checked> #1
                <input type="radio" name="mode" value="2" onclick="toggleMode(2)"> #2
                <input type="radio" name="mode" value="3" onclick="toggleMode(3)"> #3
            </p>
        </div>
        <script src="js/script.js"></script>
    </body>
</html>
Step 2. CSS
Here are all stylesheets (most of styles – just page layout styles, nothing especially)
css/main.css
/* page layout styles */
*{
    margin:0;
    padding:0;
}
body {
    background-color:#eee;
    color:#fff;
    font:14px/1.3 Arial,sans-serif;
}
header {
    background-color:#212121;
    box-shadow: 0 -1px 2px #111111;
    display:block;
    height:70px;
    position:relative;
    width:100%;
    z-index:100;
}
header h2{
    font-size:22px;
    font-weight:normal;
    left:50%;
    margin-left:-400px;
    padding:22px 0;
    position:absolute;
    width:540px;
}
header a.stuts,a.stuts:visited{
    border:none;
    text-decoration:none;
    color:#fcfcfc;
    font-size:14px;
    left:50%;
    line-height:31px;
    margin:23px 0 0 110px;
    position:absolute;
    top:0;
}
header .stuts span {
    font-size:22px;
    font-weight:bold;
    margin-left:5px;
}
.container {
    color: #000;
    margin: 20px auto;
    overflow: hidden;
    position: relative;
    width: 600px;
    height: 400px;
}
.controls {
    border: 1px dashed gray;
    color: #000;
    margin: 20px auto;
    padding: 25px;
    position: relative;
    width: 550px;
}
.controls p {
    margin-bottom: 10px;
}
.controls input {
    margin-left: 10px;
}
Step 3. JS
js/flotr2.min.js and js/flashcanvas.js
Both libraries is required and available in our package. Next – our custom file where I have implemented two different functions and three visual modes for charts.
js/script.js
var container = document.getElementById('container');
var start = (new Date).getTime();
var data, graph, offset, i;
var mode = 1;
var fmode = 1; // 1- basic sin, 2 - sin(1/x)
// toggle mode
function toggleMode(i) {
    mode = i;
}
// toggle func
function toggleFunc(i) {
    fmode = i;
}
// Draw a sine curve at time t
function animateSine (t) {
    data = [];
    data2 = [];
    // little offset between steps
    offset = 2 * Math.PI * (t - start) / 10000;
    if (fmode == 2 && offset > 15) {
        start = t;
    }
    for (i = 0; i < 4 * Math.PI; i += 0.2) {
        if (fmode == 1) {
            data.push([i, Math.sin(i - offset)]);
            data2.push([i, Math.sin(i*2 - offset)]);
        } else if (fmode == 2) {
            data.push([i, Math.sin(1/(i-offset))]);
            // data2.push([i, Math.sin(1/(i*2-offset))]);
        }
    }
    // prepare properties
    var properties;
    switch (mode) {
        case 1:
            properties = {
                yaxis : {
                    max : 2,
                    min : -2
                }
            };
            break;
        case 2:
            properties = {
                yaxis : {
                    max : 2,
                    min : -2
                },
                bars: {
                    show: true,
                    horizontal: false,
                    shadowSize: 0,
                    barWidth: 0.5
                }
            };
            break;
        case 3:
            properties = {
                yaxis : {
                    max : 2,
                    min : -2
                },
                radar: {
                    show: true
                },
                grid: {
                    circular: true,
                    minorHorizontalLines: true
                }
            };
            break;
        case 4:
            properties = {
                yaxis : {
                    max : 2,
                    min : -2
                },
                bubbles: {
                    show: true,
                    baseRadius: 5
                },
            };
            break;
    }
    // draw graph
    if (fmode == 1) {
        graph = Flotr.draw(container, [ data, data2 ], properties);
    } else if (fmode == 2) {
        graph = Flotr.draw(container, [ data ], properties);
    }
    // main loop
    setTimeout(function () {
        animateSine((new Date).getTime());
    }, 50);
}
animateSine(start);
Full documentation of flotr2 library you can find here.
Live Demo
download in package
Conclusion
Hope that today’s lesson was interesting for you as usual. We made another one nice html5 sample. I will be glad to see your thanks and comments. Good luck!


Thanks! How to make several graphics on the page?
Hi Slava,
Try to use several containers in this case.
Hi,
Thanks so much for sharing the knowledge. If you could please do a tutrial on how to take an imput using json or other format for realtime plots that would be so valuable.
Thanks again
Hey thanks for the tutorial. I’m going to make use of it for sure. I’m assuming your graph is on a loop correct? Do you have any examples of this graph with polling the data? Thanks a lot.
Hi John
Of course everything is correct, but you can also use highcharts (library) to work with charts: https://www.script-tutorials.com/highcharts-deeper-practice-for-real-statistics/